Data & BI: turn information into decisions
Data engineering, dashboards and business analytics for a clear, actionable view.
I want my free assessmentThe problem
Are your data scattered across multiple tools?
Do you spend time preparing manual reports and still lack real visibility?
The lack of a data strategy leads to slow and unreliable decisions.
The solution
With our Data & BI service:
- We centralize and clean your data.
- We design a solid data warehouse.
- We create business dashboards in Power BI, Metabase or Grafana.
- We help you define relevant KPIs and OKRs.
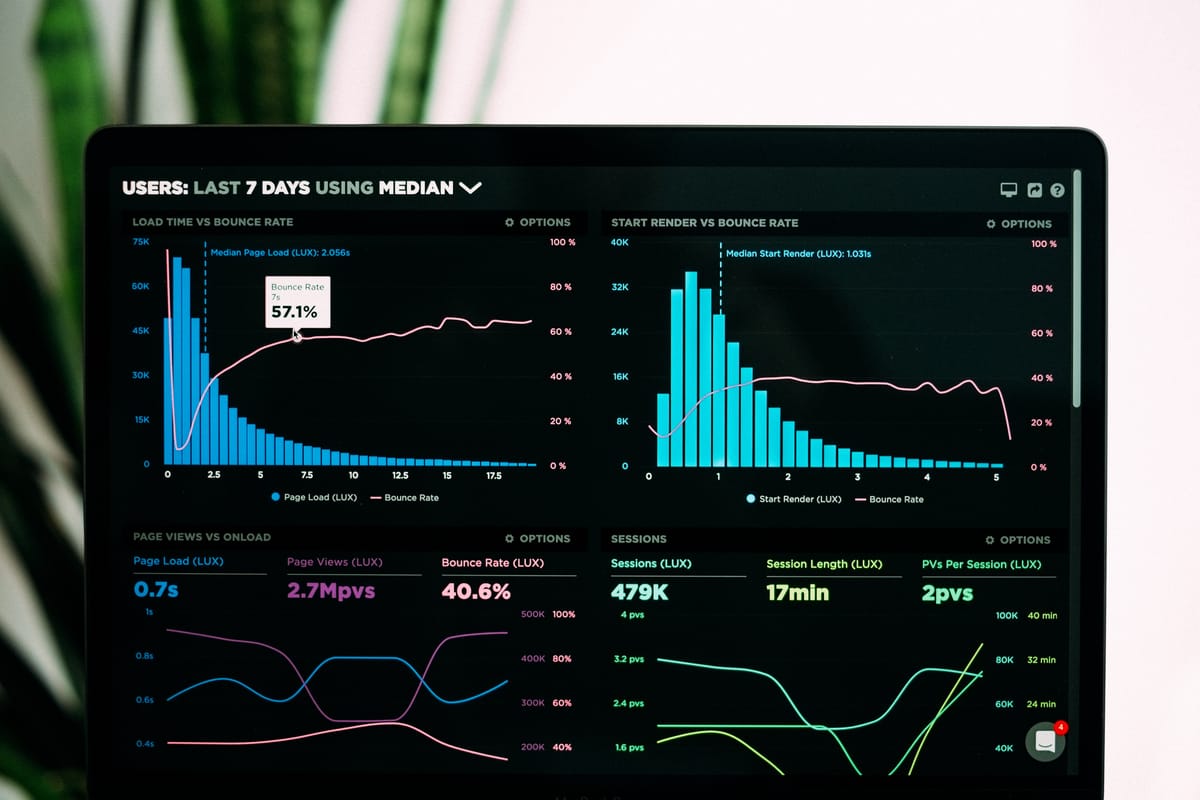
We model your data so teams can visualize actionable KPIs and speak the same business language.
Our process
- Free initial assessment → we identify your main bottlenecks.
- Architecture and design → we define the best technical solution.
- Implementation → we build pipelines and dashboards.
- Continuous iteration → we adjust KPIs to your goals.
- Support → maintenance and evolution.
Example
“In under 6 weeks we moved from manual Excel reports to a real-time dashboard that the leadership team checks every day.”
Frequently asked questions
What’s the difference between BI and traditional reporting?
Traditional reporting is static and manual; BI integrates data, modeling and visualization to deliver up-to-date, actionable KPIs.
Which tools do you use?
Power BI, Metabase and Grafana for visualization; dbt, Airflow, BigQuery, PostgreSQL or Redshift depending on the case.
How long does a typical project take?
A pilot usually ships in 2–6 weeks depending on scope; then we iterate bi-weekly.
Can I start with a small pilot?
Yes, we recommend starting with a focused use case to validate value and ROI before scaling.
You may also be interested in:
Let’s build your next digital move together
or if you prefer
Chat on WhatsAppThis site is protected by reCAPTCHA and the Google Privacy Policy and Terms of Service apply.
Copyright © 2024 - DigitalTack